CAM Research Network

Author:  Jinelle Piereder, Doctoral Researcher, Cascade Institute

Skip to the map

Cognitive-Affective Maps were first developed by Paul Thagard and his team at the University of Waterloo in 2010. In the decade since, the Cognitive-Affective Mapping method has become a key tool for several research institutes, projects, and scholars across Canada, the United States, and Germany. CAM has been used by cognitive scientists, conflict mediators, peace practitioners, social and environmental psychologists, political scientists, climate activists, early education researchers, and more.

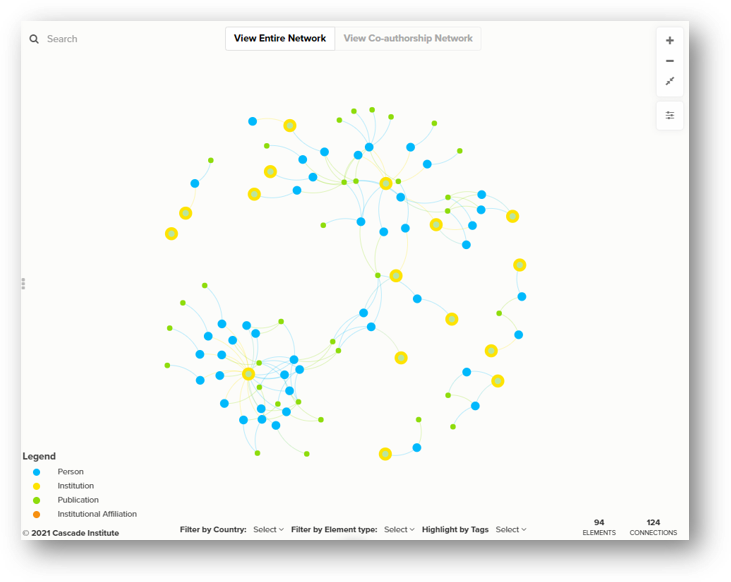
This map represents the research network of scholars and practitioners using CAM in their work, along with their current institutional affiliations and CAM-related publications. As more research is published, we will work to keep this map up to date.

You can use this map to explore who is doing this work, where the work is happening, and what interesting questions researchers are answering using CAM.

This map shows the network of researchers using Cognitive-Affective Mapping (CAM)--a novel method for visualizing belief systems, ideologies, and worldviews—plus their institutional affiliations and relevant publications. You can use this map to explore who is doing this work, where the work is happening, and what interesting questions researchers are answering using CAM.

The map is made up of:

  • Elements (the dots, known in network science as nodes). In this map, the elements are people, institutions, or publications.
  • Connections (the lines, known in network science as links). The connections represent the relationships between these elements, such as authorship or institutional affiliation.
Zoom In and Out

Zoom in and out

Zoom in and out by using your mouse’s rollerball or by clicking the plus and minus icons at the top-right of the map. Click the two arrows pointing to each other to fit the whole map in the frame. You can also grab and move the map background with your mouse to reposition your view.

Three-Dots-v3

Read an element’s profile

Read an element's profile by selecting it in the map. You may need to toggle the side panel on the left by clicking the 3 little grey dots. In the profile, you’ll see the element’s label, type (which is colour-coded and shown in the map legend), an image/logo, a description, tags, website, city/state, and country. Note that not every element has every field filled in yet (this is an ongoing project!).

Search

Search

You can search for specific people, institutions, or publications in the search bar at the top-left of the map.

Customize

Customize Your View

Using the three dropdown menus at the bottom of the map, you can filter the data by country or by node type by (de)selecting one or more options in the list.

Highlight by Tags

Highlight by Tags

Highlight elements with only certain tags (and fade everything else into the background) by selecting one or more Tags in the last dropdown menu. Click the Tags again to de-select them.

Focus

Focus

When you have one or more elements selected, the “focus” button will appear at the top-right of the map underneath the zoom buttons. Click it to filter away (hide) all the other map data. Use the up and down arrows to increase or decrease the number of connections away from your focus. The number of elements and connections in your current focus is displayed at the bottom of the map.

Shift Button

Select multiple elements or connections

You can select multiple elements or connections by holding down the “shift” key.

Three-Dots-v3

Minimize this panel

Minimize this panel by clicking the three little vertical dots icon next to the middle of the scroll bar.